An alternative to scanning samples

Post Reply
Roberto
Posts: 1
Joined: 15 Feb 2009, 17:45
Real name: Roberto Furnari
Contact:

An alternative to scanning samples

Post by Roberto »

My dendrochronological research is focused on musical instruments, mainly from the violin family. Therefore using a scanner is not an option, as violin tops are always arched. Accordingly I have always been working with a photo camera.

I use a reflex camera, Nikon D80, together with a 150mm macro lens. But any lens with a focal length of 100mm or higher will be suitable for dendrochronological analysis. It should, however, be a macro lens. True macro lenses are fix-focal lenses, which means that their optical design is optimized without compromises for one focal length, resulting in sharp and virtually distortion-free images.
Most of the ordinary lenses, on the contrary, are zoom lenses which usually suffer from barrel distorsion at one end of the zoom range and from pincushion distortion at the other end. Only a small part of the range is free from distortion. Additionally, the minimum focusing distance of these lenses is significantly higher than that of macro lenses. This means that you will not be able to get close enough to the sample, resulting in photos with a too low resolution.

However, also macro lenses would produce low resolution photos if I would insist on taking the picture with a single shot. When photographing half a violin top plate (ca. 10cm) with a 10MP camera the resulting resolution would be about 980dpi, which is much too low for serious measurements.

My minimum requirement for violins is 2500dpi (ca. 0,01mm/dot); I am a little bit less demanding as far as cellos or double basses are concerned (2000-2200dpi), as they generally have a higher average ring width.

The trick to nevertheless achieve the required resolution is to take partial photos which can be put together with a stitching software.
"Photo stitching is the process of combining multiple photographic images with overlapping fields of view to produce a segmented panorama or high-resolution image" (from Wikipedia)(1).

I will describe my method using the example of half a violin top plate.

First I put a ruler made from paper across the violin. The ruler has markers (black rectangles) at 25mm intervals to aid with framing. As I already mentioned, dedicated macro lenses have no zoom mechanism, therefore I adjust the distance of the camera in order to see a 35mm portion of the ruler centered around two markers when looking through the viewfinder. Making the pictures wider than the distance between the markers ensures that there will be enough overlap between the photos, which is required by the stitching software to work properly.
To make sure that all photos have (almost) the same resolution, an exact lateral movement of the camera is required. I achieve this by using a sliding micropositioning plate, which is a device that enables an exact linear movement of the camera (2). Here is a photo of a typical set up:
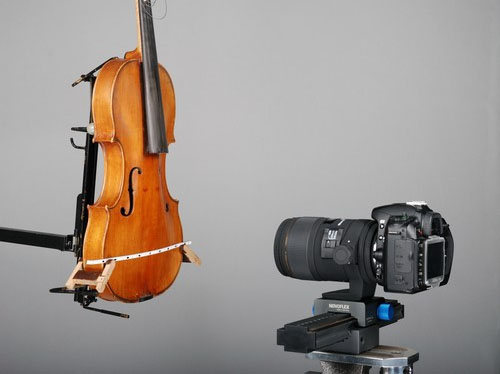
Image


To cover half a violin top plate I need four photos:

Image

The black rectangles serve also as references for the stitching software, to help finding corresponding areas between the photos. Year rings alone often do not have enough details for the pattern matching algorithms.

The stitching process is automatic. However, manual corrections are regularly required. The millimeter division of the ruler helps with checking whether the photos have been put together correctly.

Image


This is a 100% crop of the photo above, viewed in CooRecorder. The resolution is 2625dpi:

Image


To check the linearity of the stitched photo I performed a "rulertest".
(See also: http://www.cybis.se/forfun/dendro/helpc ... ?calibrate) (Link edited 2016-04-20/LÅL)

This is the result:

Image

The "ring width curve" made from the millimeter marks drops slightly towards the right because the positioning plate is not running exactly parallel to the violin, which actually is impossible to achieve as violin tops are always arched.

I have divided the 101 points of the measurement series into four segments and calculated the mean value of each segment to quantify the non-linearity.

From the left to the right:
1st segment (100-75) mean value=1,011mm
2nd segment (74-50) mean value=1,004mm
3rd segment (49-25) mean value=0,996mm
4th segment (24-0) mean value=0,986mm

Altogether this is a perfectly acceptable result. It will probably be even better when working with flat samples.

I agree that to take accurate photos of samples for dendrochronological analysis the first choice should always be a scanner. But if a scanner is not an option because the sample is not flat, as in my case, or because the sample is too big or too heavy (e.g. a piece of furniture) or for some other reason, the method I described is a practical alternative.

---------------------------------------

Notes:

(1) I use alternately two stitching tools: PanoramaMaker which I found on the CD-ROM that was shipped with a Panasonic camera I purchased a few years ago, and PhotoStitch which is shipped with Canon cameras. Occasionally one software struggles more than the other to put the single pictures together correctly, therefore I sometimes switch between the two. Apparently they work with different algorithms.

Here you will find a list of stitching tools. However, excluding PanoramaMaker, I am not familiar with any of them.


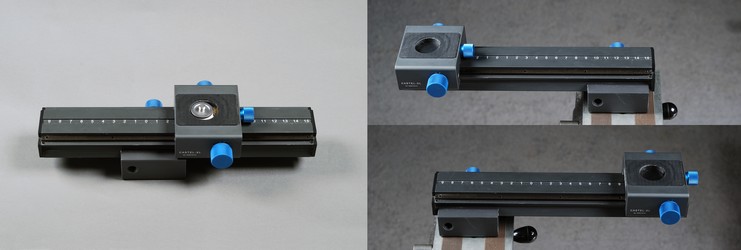
(2) I have purchased mine (Novoflex CASTEL-XL) at Brenner,
a German mail-order business for photographic equipment. (Unfortunately the site is only in German).
Image

The upper block, which carries the camera, can be accurately positioned with the knob at the front. The beam that on its part carries the upper block can be pushed back and forth to increase the effective length of the adjustment track to 380mm, despite the length of the beam being only 256mm.

I have chosen for this large range in order to be able to measure double basses in one operation. More common lengths of the adjustment track vary between 100mm and 150mm.

This is an English site advertising the Manfrotto454:
http://www.bristolcameras.co.uk/p-manfr ... -plate.htm
taxelson
Site Admin
Posts: 19
Joined: 28 Dec 2008, 18:39
Real name: Torbjörn Axelson
Location: Björbo, Dalarna, Sweden
Contact:

Re: An alternative to scanning samples

Post by taxelson »

Thank you, Roberto, for this very nice presentation!
And the quality of your images, produced by the described method and equipment, are indeed impressing!

I do agree on the most things you write, except the resolution needed for credible datings (also much poorer resolution will usually work fine!) If a dating is credible or not depends on correlation values, visual curve control, and "helping context" if present (i.e other wood from the same context, giving a similar result) And so I think the use of panorama software is a bit overdoing (even if beautiful, indeed!) – copy the original images beside each other in a wide image document using GIMP or Photoshop, save as .jpg, and just bridge the gaps with CooRecorder works fine! Actually, also with scanned cores it is often unavoidable to work with much "lower practical resolution" i.e less number of dots per ring, according to very narrow rings. Here is an example of that from a project of mine of the last week, a barn from 1758-59:

Image

Core id is FHKA03a and the most narrow rings are just 0.07 respectively 0.09 mm! (and aproximately 6-9 dots) The resolution is formally 2400 dpi, but as seen not very clear. But higher resolution will unfortunately not increase the result very much, when measuring total ring widths only, according to my experience. The main problem is to really be able to detect those very small rings, which may very well be absent in parts of the circuit, and than even in very strong magnification, they are still not visible.

A report (in Swedish) on the barn dating with rwl-files included are at http://www.taxelson.se/dendro/obj/FHKA.pdf . Fortunately for violin-dendro, absent rings are much more rare in spruce than in pine.

As I do myself mainly work with cores, and scanner, however, sometimes I also try to catch tree ring patterns with a camera from things like sanded floors, furnitures and things like that. Such things are in my area normally made of pine tree wood (Pinus sylvestris), but sometimes also of spruce wood (Picea abies). Such "trials" are often done a bit spontaneously and they are not always successful. One reason is of course that my equipment is very simple (see below). I am able to make images with a resolution with about 1000-1200 dpi, but even if I did have an equipment like Robertos I think I often would fail anyway, according to any of the following reasons:
1.The surface is not plain enough.
2.The rings are too narrow (Wood like that in the example above, can be properly measured from crosscuts only) Unfortunately that kind of extremely narrow ringed wood – often even worse than that above - was often used for furnitures made in the northern Scandinavian countryside.
3.In pine tree wood, there are often white resin vessels in the late wood, which will be difficult to distinguish from early wood if the rings are very narrow.
4.The direction of the light is critical. Direct flash is useless and so also light coming from the side. It has to incline along the wood structure.

I am using a Minolta Dimage F300 which is just a compact camera bought 5 1/2 years ago. It is said to give 5 M pixel but 4 M pixel mode gives as good images, so I only use that – the rest is just blur. The macro do focus at a distance down to about 150 mm between the leans and the object, and the image width is than about 45 mm. Of course this is not the optimal camera for this purpose, but the results may anyway be of some interest, to show that not only the very best equipment is useful. This camera use to be in my pocket, so sometimes I get unexpected opportunities to portray some rings! Instead of a stative just a ruler, or a piece of thin wood, could be used to ensure that the distance between the camera and the object will be the same for all the images.

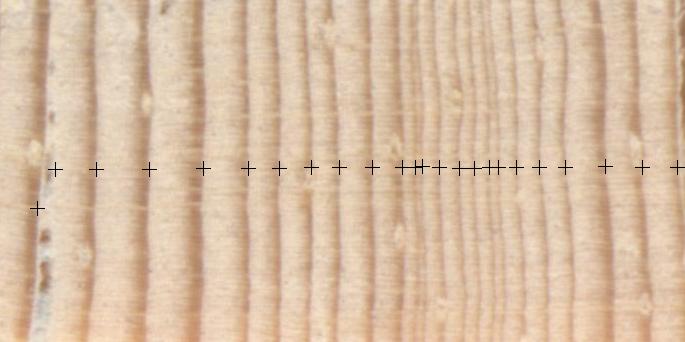
Image

Just to demonstrate I used one of the 4" boards of pine tree in my floor, just here I am.
Image

Code: Select all

G9o1aT2 1819   224
G9o1aT2 1820   193   222   122   175   214   165   122   118   134   124
G9o1aT2 1830   143   116   108    69    65    59    69    51    39    30
G9o1aT2 1840    23    22    26    29    35    36    29    28    39    35
G9o1aT2 1850    28    35    42    27    28    39    45    69    73    55
G9o1aT2 1860    49    59    55    55    43    59    53    40    31    30
G9o1aT2 1870    41    43    34    31    24    27    26    33    55    63
G9o1aT2 1880    96    53    52    33    71    57    59    69    53    66
G9o1aT2 1890    61    42    63    61    59    84   100   108    85   120
G9o1aT2 1900   106   999
(1848-1871 are the ones marked at the image)
This image was taken in almost optimal light, and I was able to get the camera to focus close enough to produce images with as much as 1248 dpi (if the light is not so good, the auto focus works poorer). The light have to be in the same direction as the wood, and not from the side. Even if the distortion from the camera is low enough according to the ruler test, the saw cut on a floor board is often not through the pitch and therefore the inner rings are a lot to wide. It is therefore normally not a good idea to mix such measurements in a reference collection, but if it is from an area or an age where you have not enough other data, it may be better than nothing – if shared with care... The neg-exp detrend function of CDendro will also take care of the effect If you like!

In this example the narrowest ring is about 0.2 mm and I think that wood with more than 3 or 4 rings per mm is normally not datable with this method when dealing with normally sanded or planed wood. The much higher finish of violins, and the absence of the white vessels in spruce wood will surely make it possible to identify rings more narrow than that if resolution is high enough!

To increase the measurement quality when the image quality is low, you may measure the same sequence twice and make a mean of them.

So, using the mean of two series from the same photo it will date to 1900 towards a range of more or less local chronologies.

Code: Select all

Cybis CDendro, Algorithm: Proportion of last two years growth (2,0,T)
Correlations between available references in PISY-Skandinavien080812_6.fil and
G9o1aT2m.wid dated to 1900 with corr >= 0,40 and with overlap >= 81
Results sorted according to decreasing correlation coefficient values.
                    T-  Over
           Corr   Test   lap
all...     0,54   5,67    81   based on 7 members
SolorNor   0,47   4,68    81  Solør, sydöstra. Norge (digitaliserat av Arne Andersson)PISY
Sfsn-PIS   0,43   4,29    81  Sfsn   1 Säfsnäs socken, Dalarna                        PISY
FlodaSn0   0,43   4,21    81  Floda sn, Dalarna (mainly Björbo) (ej swed305)          PISY
swed016    0,41   4,04    81  Glaskogen, Värmland (Schweingruber)                     PISY
fletab2    0,41   3,95    81  norska data A.A0702                                     PISY
swed309A   0,40   3,92    81  Aneby, Småland (Bredesta/Lysing)                        PISY
ESVEALAN   0,40   3,89    81  East Svealand Aneby+Askersu+Bettna+Sissham+Saltsjöba    PISY
  
Well, not a good match but as I know the house was build 1914 it is surely right.
Making a mean of those references and than testing the two measured cores and the mean, gives this result:

Code: Select all

Cybis CDendro (Jan 24 2009), Algorithm: Proportion of last two years growth (2,0,T)
Correlations between each of 3 checked members (=all members) of the collection G9o1aT2.fil
and the reference PISY-Skandinavien080812.d12 dated to 2006
First column group is based on dating of the collection to 1900. (Offsets are relative to reference.)
Minimum overlap used when finding best match: 50
                  Member offset to ref
                  Off Over  Corr TTest
         Years    set  lap coeff      
all...      82    106   81  0,53   5,6
G9o1aT2     82    106   81  0,49   5,0
G9o1aT2b    81    106   80  0,53   5,5
G9o1aT2m    82    106   81  0,54   5,7
Mean corr. of first column when overlap >= 50 (3 samples): 0,52 
Standard deviation intervall 0,50 – 0,54
The low correlation values are probably not a result of the method. I did also test with another board from the same floor:

Code: Select all

Cybis CDendro, Algorithm: Proportion of last two years growth (2,0,T)
Correlations between available references in PISY-Skandinavien080812.fil and G9o13a.d12 (mean of two) dated to 1897 with corr >= 0,52 and with overlap >= 55
Results sorted according to decreasing correlation coefficient values.
                    T-  Over
           Corr   Test   lap
all...     0,80  10,83    69   based on 16 members
Petmyra    0,75   9,28    69  Petmyra (bogg), Björbo, Dalarna                         PISY
SödraDal   0,72   8,58    69  Södra Dalarna                                           PISY
FlodaSn0   0,70   8,00    69  Floda sn, Dalarna (mainly Björbo) (ej swed305)          PISY
swed016    0,70   7,99    69  Glaskogen, Värmland (Schweingruber)                     PISY
BjörboGr   0,70   7,99    69  Swed305 Björbo+Grangärde                                PISY
swed305    0,66   7,19    69  Björbo, Dalarna                                         PISY
SolorNor   0,65   7,02    69  Solør, sydöstra. Norge (digitaliserat av Arne Andersson)PISY
Grangard   0,65   6,92    69  Grangärde, Dalarna                                      PISY
swed305S   0,64   6,90    69  swed305+Risholn,Leksand+gamla fr Grangärde (17/2 2006)  PISY
Swed307A   0,64   6,80    69  Lerbäck, Askersund                                      PISY
Sfsn-PIS   0,63   6,68    69  Sfsn   1 Säfsnäs socken, Dalarna                        PISY
BratPISY   0,59   5,91    69  Mälardalen area, publ. Bråthen                          PISY
fletab2    0,57   5,72    69  norska data A.A0702                                     PISY
idre       0,52   5,04    69  Idre, Dalarna                                           PISY
Sissh041   0,52   4,48    55  Sisshammar (T. Andreasson)                              PISY
se007      0,52   4,59    60  Dalarna region (Lunds Universitet, "extraterastrial")   PISY
In this case the values are very good, although the rings also are a bit broader, I think the main reason simply is that the first tree does not give better values than that. Such corr values are indeed rather normal in this area.

Here are the raw data for all samples:

Code: Select all

G9o1   1 Floor boards TA's house, Björbo                     PISY
G9o1   2 Sweden       Pinus sylvestris    200  6027N1442N          1819 1900
G9o1   3 T. Axelson
G9o1    #### Ring pattern caught with camera with resolution of aprox. 1200 dpi. The inner rings are overestimated due to sawing beside the pitch.
G9o13a1 1828   169   148
G9o13a1 1830   157   140    90   118   127    83    77    76    64    81
G9o13a1 1840    63    46    51    48    67    58    67    60    78    65
G9o13a1 1850    60    37    30    41    63    64    65    71    81    95
G9o13a1 1860   106    86    87    77    92    76    76    60    86    74
G9o13a1 1870    83    81    90    71    93    90    71    60    83    56
G9o13a1 1880    78    47    73    40    57    60    67    58    46    70
G9o13a1 1890    64    86   106   111   127   111   120    83   999
G9o13a2 1828   201   145
G9o13a2 1830   150   139   106   127   132    83    83    76    58    85
G9o13a2 1840    60    42    53    49    69    53    69    63    76    64
G9o13a2 1850    63    46    28    25    62    63    64    65    92    95
G9o13a2 1860    97   102    90    71    90    83    67    63    85    74
G9o13a2 1870    85    81    81    74    99    97    58    69    65    51
G9o13a2 1880    51    55    99    46    67    65    60    49    55    72
G9o13a2 1890    76    76   106   104   122   107   115    90   999
G9o1aT2 1819   224
G9o1aT2 1820   193   222   122   175   214   165   122   118   134   124
G9o1aT2 1830   143   116   108    69    65    59    69    51    39    30
G9o1aT2 1840    23    22    26    29    35    36    29    28    39    35
G9o1aT2 1850    28    35    42    27    28    39    45    69    73    55
G9o1aT2 1860    49    59    55    55    43    59    53    40    31    30
G9o1aT2 1870    41    43    34    31    24    27    26    33    55    63
G9o1aT2 1880    96    53    52    33    71    57    59    69    53    66
G9o1aT2 1890    61    42    63    61    59    84   100   108    85   120
G9o1aT2 1900   106   999
G9o1aT2b1820   181   203   114   171   212   167   116   128   134   129
G9o1aT2b1830   126   120   110    85    67    55    72    46    39    26
G9o1aT2b1840    27    22    27    26    33    30    25    24    47    39
G9o1aT2b1850    34    37    47    20    27    36    47    61    75    51
G9o1aT2b1860    51    57    55    57    43    59    53    30    35    28
G9o1aT2b1870    53    45    37    34    23    24    27    34    49    59
G9o1aT2b1880    98    53    42    27    69    57    67    59    59    67
G9o1aT2b1890    62    46    61    53    67    88   104   100    75   114
G9o1aT2b1900   124   999
G9o1aT2m1819   224
G9o1aT2m1820   187   212   118   173   213   166   119   123   134   126
G9o1aT2m1830   134   118   109    77    66    57    70    48    39    28
G9o1aT2m1840    25    22    26    28    34    33    27    26    43    37
G9o1aT2m1850    31    36    44    24    28    38    46    65    74    53
G9o1aT2m1860    50    58    55    56    43    59    53    35    33    29
G9o1aT2m1870    47    44    36    32    24    26    26    34    52    61
G9o1aT2m1880    97    53    47    30    70    57    63    64    56    66
G9o1aT2m1890    62    44    62    57    63    86   102   104    80   117
G9o1aT2m1900   115   999
Best regards, Torbjörn
Post Reply

Who is online

Users browsing this forum: No registered users and 0 guests