|
Skeleton plot
|
 |
Quick start:
Skeleton plotting is available in CDendro when any of the two Skeleton alternatives is selected as "Check to display" in the Settings/Options for normalization... window.
|
|
 |
|
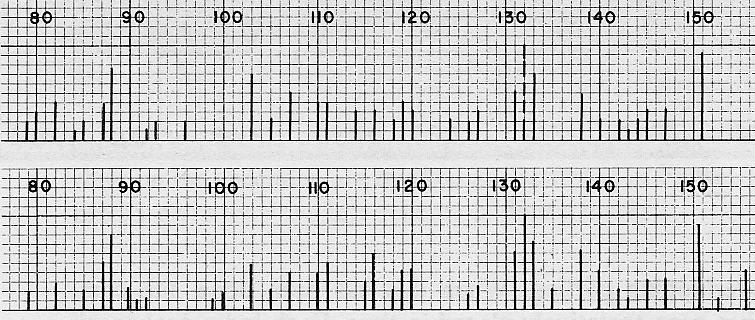
In pre-computer times dendrochronologists had to rely on techniques which are not calculation intensive, but
instead made the most of the human capacity of pattern recognition.
Skeleton plots were drawn by hand on graph paper. Each vertical line on the graph paper correponds to one ring
of the sample.
The ring widths are inspected with a magnifying glass and vertical lines of various height are drawn for those
lines which are narrow. Especially wide rings are marked with a "b" (broad). "Normal rings" are left undrawn.
If you draw your plots on strips of graph paper, these strips can be horizontally shifted relative to each other so
you can find where the plots match each other.
|
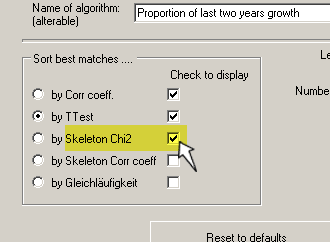 |
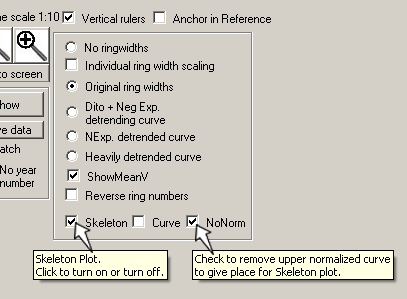
To enable skeleton plots in CDendro, click the menu command Settings/Options for normalization and matching.
Then check the appropriate checkbox as shown above and click OK.
|
 |
|
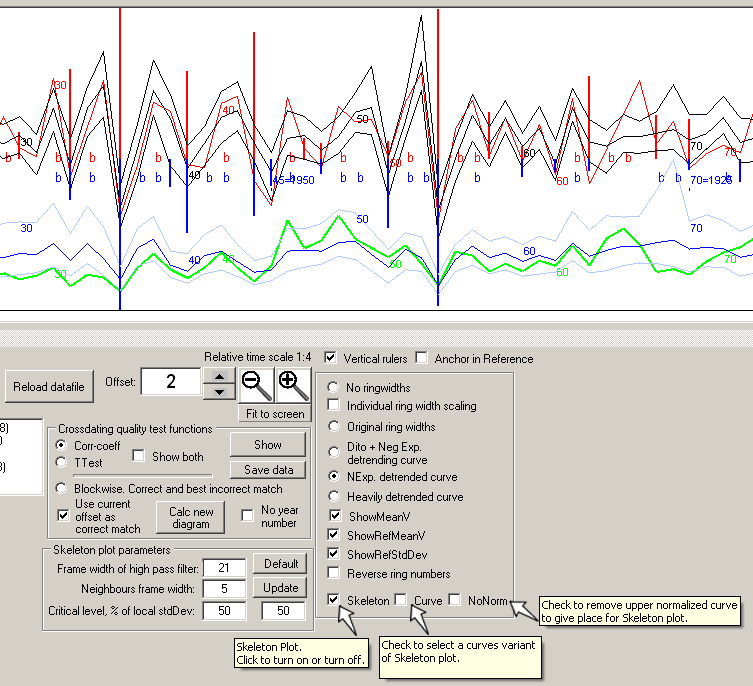
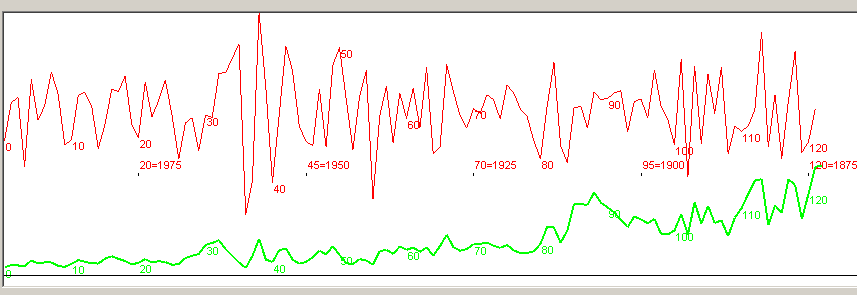
This is the normal view of your sample in CDendro.
|
 |
|
To get your skeleton plot, make the checkboxes checked as shown above!
|
 |
 |
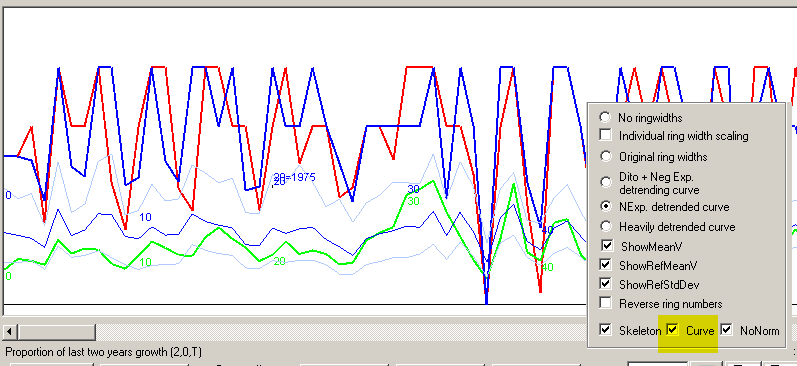
Here, the curve is shown detrended (and somewhat zoomed out) to make the calculations behind the skeleton
lines more obvious.
(The slider (trackbar) of the "Settings/Plotting window settings/Set relative height of ring width curves" has also been somewhat adjusted to make the ring width curve higher.)
|
 |
When there is a reference available, this is plotted as a blue upside-down skeleton plot.
You can remove the growth curves by unchecking the checkboxes shown at (1) above.
A statistical Chi Square value for the current match between sample and reference is also available, as shown at (2) above.
|
 |
|
The usefulness of Skeleton Chi2 values as calculated in CDendro may really be questioned for the type of dendrochronological datings we are doing in Sweden!
If we only use the Skeleton Chi2 values as the selection criteria when dating 80 year long blocks of Scots pine grown here in Saltsjöbaden towards a reference curve from the nearby island of Nämdö, we will only have some 30% of
our blocks with Chi2 values above 15 though with one third of them with a wrong dating.
|
 Based on CDendro standard methods for crossdating
|
|
When we use the standard methods of CDendro for crossdating, and require TTest values above 5.5, some 50% of the
blocks can be crossdated with a very low error frequency!
Note: For more details behind the tables above, see the section "On Gleichläufigkeit".
|
 |
|
There is also a "Skeleton Curve" available in CDendro. Here, rings which have no "skeleton marker" (vertical line)
are given one of two values depending on if they are "wide rings" or "normal rings".
A normal correlation coefficient can be calculated for two such curves (red and blue) laying over each other.
|
 |
|
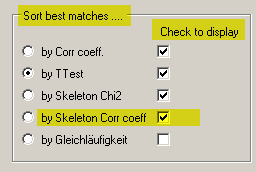
To make the "skeleton correlation coefficient" being calculated, you have to enable
it through the menu command Settings/Options for normalization and matching as shown above.
|
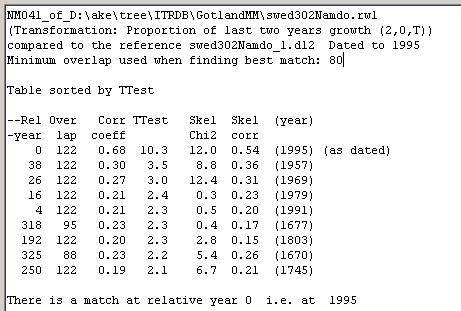 "Skeleton correlation coefficients" are shown in the crossdating tables of the Workbench tab.
|
 |
|
The quality of this coefficient is reasonably good, but not as good as that of the standard method of CDendro.
|


