Rebuilding the period 814-1974
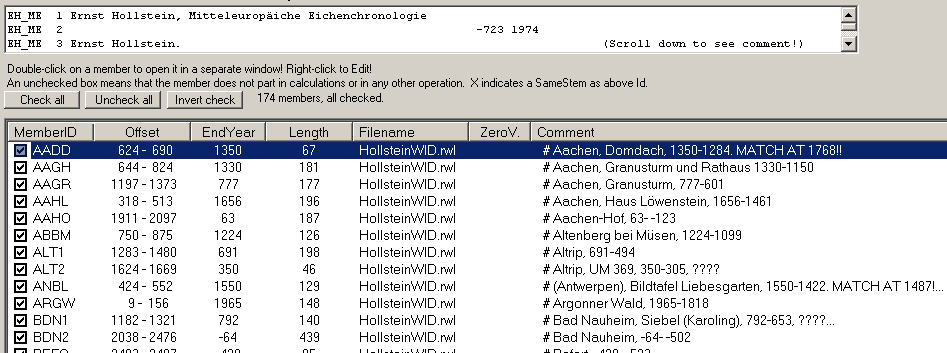
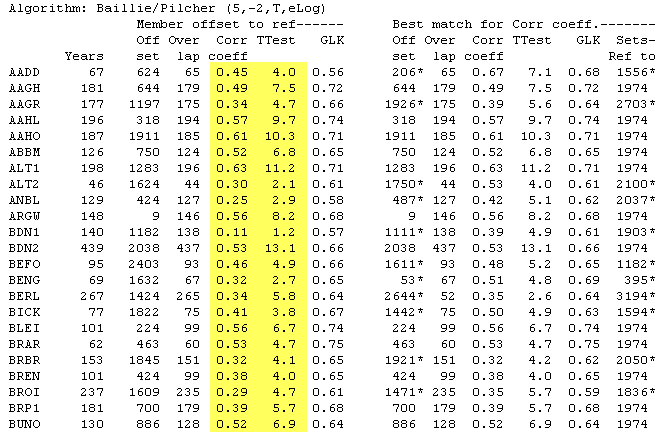
So let us use this collection to build new collections with properly crossdating samples!
Clear the report and click the button "Find cross correlations"!

Then in the Hollstein collection, press the button "Add best members to target collection".
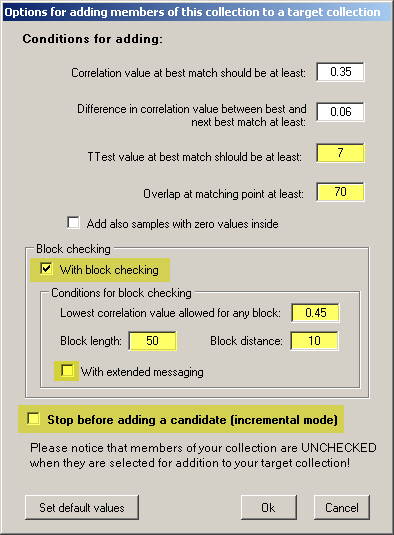
In the dialog window, above, see that TTest value at best match is set to at least 7 with Overlap at matching point to at least 70.
Set With block checking to UNchecked for this first run.
See that Stop before adding a candidate is checked.
Press OK!
Click OK in the next pop up box, telling about which sample was selected.
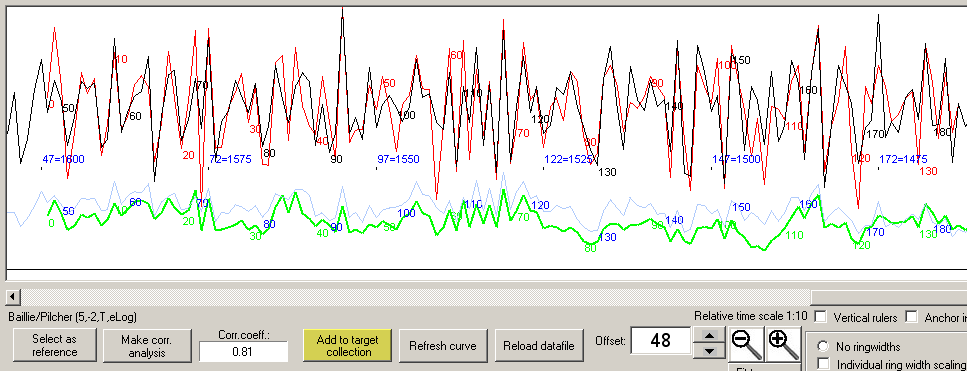
Accept the offset and click OK. Then close this sample!
|
In the HollsteinWid collection, again click the button "Add best members to target collection"! Best is to continue this way and inspect each selected candidate before adding it to the target collection. Though for now, we will allow the process to go automatic by UNCHECKING the "Stop before adding a candidate (incremental mode)" checkbox! Also check "With block checking" and see that the lowest allowed correlation value is set to 0.45, blocklength to 50 and block distance to 10.
The checkbox "With extended messaging" can be set unchecked for now.
|
The following additions will be reported:
TRM3 298 years added at 0 TRMU 139 years is candidate for offset 48 with corr=0.81 TTest=16.0 Overlap= 137 BNDiff=0.54 TRD1 327 years added at 197 with corr=0.69 TTest= 9.3 Overlap= 99 BNDiff=0.40 Worst block check value =0.61 at index 30 TRD2 300 years added at -102 with corr=0.67 TTest=12.7 Overlap= 196 BNDiff=0.38 Worst block check value =0.58 at index 122 TRSS 177 years added at 299 with corr=0.67 TTest=11.8 Overlap= 175 BNDiff=0.36 Worst block check value =0.59 at index 110 TMB3 258 years added at -58 with corr=0.66 TTest=12.2 Overlap= 198 BNDiff=0.38 Worst block check value =0.54 at index 78 SCHW 83 years added at 75 with corr=0.70 TTest= 8.7 Overlap= 81 BNDiff=0.35 Worst block check value =0.66 at index 0 TRM4 101 years added at 57 with corr=0.71 TTest=10.0 Overlap= 99 BNDiff=0.38 Worst block check value =0.69 at index 49 TMK1 198 years added at 45 with corr=0.67 TTest=12.4 Overlap= 196 BNDiff=0.32 Worst block check value =0.55 at index 50 TRHM 134 years added at 524 with corr=0.66 TTest= 9.9 Overlap= 132 BNDiff=0.32 Worst block check value =0.52 at index 0 TRSO 93 years added at 565 with corr=0.75 TTest=10.7 Overlap= 91 BNDiff=0.26 Worst block check value =0.74 at index 0 OWSM 86 years added at 372 with corr=0.62 TTest= 7.1 Overlap= 84 BNDiff=0.25 Worst block check value =0.55 at index 34 SLBU 319 years added at 139 with corr=0.58 TTest=12.6 Overlap= 317 BNDiff=0.25 Worst block check value =0.49 at index 180 TRST 125 years added at 332 with corr=0.63 TTest= 8.9 Overlap= 123 BNDiff=0.31 Worst block check value =0.54 at index 60 SPED 101 years added at 357 with corr=0.61 TTest= 7.6 Overlap= 99 BNDiff=0.23 Worst block check value =0.53 at index 30 TRHB 186 years added at 472 with corr=0.57 TTest= 9.2 Overlap= 184 BNDiff=0.22 Worst block check value =0.51 at index 60 XANT 233 years added at 582 with corr=0.66 TTest= 8.8 Overlap= 100 BNDiff=0.31 Worst block check value =0.50 at index 50 WINK 202 years added at 729 with corr=0.67 TTest= 8.1 Overlap= 84 BNDiff=0.43 Worst block check value =0.67 at index 20 TRSM 117 years added at 692 with corr=0.58 TTest= 7.6 Overlap= 115 BNDiff=0.27 Worst block check value =0.57 at index 50 There are no samples left which fulfil the conditions: Best correlation >= 0.35, Difference to next best >= 0.06, Best TTest >= 7.0, Overlap >= 70 and the Block correlation restrictions. The automatic adding process is stopped! Please continue by hand! |
|
Now, we will see if we can find some more samples that can be added with acceptable crossdating quality.
In the Target collection, click "Create mean value sample" and see that that sample is selected as the reference. In the HollsteinWid collection, again click "Add best members to target collection".
You will get the following report: AAHL with corrCoef=0.52 targeted at index 151 (1656) failed on block check at 40 (0.18) BURE with corrCoef=0.60 targeted at index 694 (1113) failed on block check at 180 (0.40) FILK with corrCoef=0.55 targeted at index 27 (1780) failed on block check at 80 (0.34) HERB with corrCoef=0.59 targeted at index 657 (1150) failed on block check at 10 (0.38) HETR with corrCoef=0.64 targeted at index -167 (1974) failed on block check at 294 (0.38) KDCG with corrCoef=0.54 targeted at index 496 (1311) failed on block check at 130 (0.44) KIBG with corrCoef=0.60 targeted at index 57 (1750) failed on block check at 90 (0.41) KOLE with corrCoef=0.52 targeted at index 176 (1631) failed on block check at 20 (0.39) MUEB with corrCoef=0.64 targeted at index 708 (1099) failed on block check at 160 (0.38) OBER with corrCoef=0.56 targeted at index 276 (1531) failed on block check at 20 (0.41) PUTM with corrCoef=0.50 targeted at index 269 (1538) failed on block check at 90 (0.24) SIND with corrCoef=0.56 targeted at index 382 (1425) failed on block check at 125 (0.42) SINZ with corrCoef=0.55 targeted at index 590 (1217) failed on block check at 10 (0.45) TPNI with corrCoef=0.49 targeted at index 769 (1038) failed on block check at 80 (0.34) TRDS with corrCoef=0.51 targeted at index 762 (1045) failed on block check at 117 (0.33) TRMB with corrCoef=0.61 targeted at index 460 (1347) failed on block check at 100 (0.34) There are no samples left which fulfil the conditions: Best correlation >= 0.35, Difference to next best >= 0.06, Best TTest >= 7.0, Overlap >= 70 and the Block correlation restrictions. The automatic adding process is stopped! Please continue by hand!The list shows several samples with good overall crossdating quality, though with at least one segment (block) with not soo good quality. We may decide to add these members to the target collection by hand after inspection. We may also consider to strip off mismatching sections, like the oldest 8 years of "HETR" and add it. When successively adding new samples to the target, it is a good idea to also recreate the reference after each addition (the button Create mean value sample). When ready adding, we may run an extra "Add best members to target collection" to find even some more samples to add. When we are back to year 814 we stop adding more samples and save the target collection as
Note that this collection is of a higher quality than what we get when we extend the collection as shown below!
|
Extending the built period 814-1974 to 410-1974
We may continue back to year 410 adding samples, though the crossdating quality is not always convincing..
When we add TRAM we may consider to remove the youngest 50 ring widths (there seems to be two missing rings somewhere) and rename to TRAMC.
P.S.Or should TRAM be dated 207 years older? See below!
We may also add ERP2.
We save the new collection as HollsteinBestLateToYear410.rwl
For your research purposes that file is available here: HollsteinBestLateToYear410.rwl
A Test towards rest of collection command will show a collection which seems to have a good crossdating quality.
|
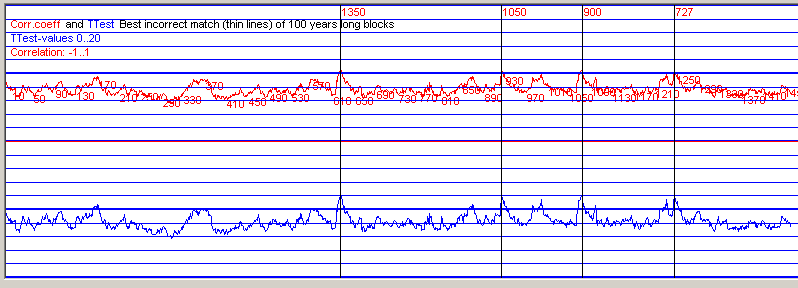
Though, if we run a Crossdating Quality Test function/Blockwise on the mean value curve
(see that it is also selected as the reference)
with a block length of 100, then we will get two pairs of tops!
One pair at 900 and 1350 and the other pair at 727 and 1050. This means that a block taken from year 801-900 matches with a corr.coeff=0.50 and TTest=5.7 at year 1349. And that a block taken from 627-727 matches at 1049 with a corr.coeff=0.51 and TTest=5.9. An investigation reveals that the 727/1050 tops seem to be related to the curves PBBF (Petersberg bei Fulda) and MB16 (Mainz, Brand end year 673). The probable cause may be an unfortunate coincidence - or - it may be related to an error done when these curves were created by Hollstein. When samples are found together it is very tempting to think that they are from the same time and then add them together when they crossdate reasonably well. Though when one of the samples is not contemporary with the others we will then copy a signature from another time to a place where it should not be. |
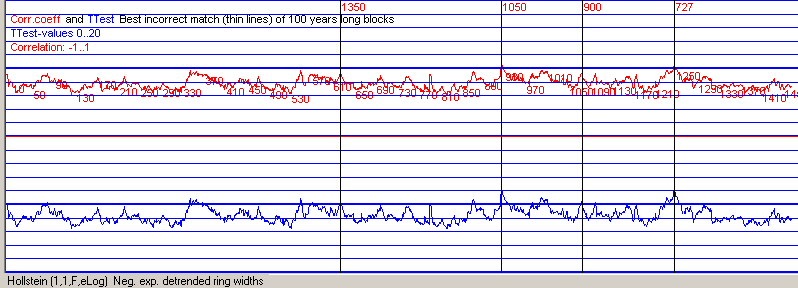
The diagram shows the same curve as above when the Hollstein normalization method has been selected.
Rebuilding the Roman time chronologyFor your research purposes, here is a reasonable collection: HollsteinBestRoman.rwl which covers the time BC340 - AD337 with the dating used by Hollstein. |
A careless connection
Let us be quite a bit careless and see if our Roman time collection already matches our Late time collection.
Transformation: Baillie/Pilcher (5,-2,T,eLog)
--Rel Over   Corr TTest   GLK  (year)
-year  lap  coeff
 1431  132   0.41   5.1  0.68   (543)
  741  674   0.15   4.0  0.54  (1233)
  882  674   0.15   3.8  0.52  (1092)
 1150  413   0.18   3.7  0.53   (824)
  221  674   0.13   3.4  0.54  (1753)
  431  674   0.13   3.4  0.56  (1543)
  549  674   0.13   3.4  0.54  (1425)
 1412  151   0.26   3.3  0.62   (562)
 1106  457   0.15   3.2  0.54   (868)
Ooops!! Our Roman time collection, supposed to be dated to year 336 matches at year 543. I.e. 207 years seem to be lost from our chronology! Note: The method used for normalization sometimes influences the crossdating more or less.
Transformation: Hollstein (1,1,F,eLog)
--Rel Over   Corr TTest   GLK  (year)
-year  lap  coeff
 1431  133   0.50   6.7  0.68   (543)
  431  675   0.16   4.1  0.56  (1543)
  579  675   0.13   3.5  0.53  (1395)
 1258  306   0.19   3.4  0.59   (716)
  221  675   0.12   3.2  0.54  (1753)
   33  675   0.12   3.1  0.53  (1941)
 1231  333   0.16   3.0  0.56   (743)
 1412  152   0.24   3.0  0.62   (562)
An analysis of this "207-years-cut-away" alternative shows that it is mainly the 188 years long KORB (Köln Rheinbrücke, 336-149) curve that creates this match towards a group of curves: ALT1+ERP2+FB27+MB53+MB73+MUES+TRAM (691-410). The KORB curve is described on page 74 of Hollstein's book as Köln, römische Rheinbrücke (Bracker, 1966). The curve is built from four trunks with their ring width data overlapping each other quite well according to a table in Hollstein's book. KORB itself matches that group with corrCoeff=0.39 (Hollstein 0.48), though to one of the members (TRAM) it is 0.47. If we want to keep our 207 years, we have to reject the match between KORB and that group of members. Though, what is rigth is not clear to me! There are also those left over samples above, notably neth002+neth006 but also BERL, BROI, KKNA.
Where should they be placed? A check reveals that with 207 years lost there is no reasonable place for them...
An error of this type should hopefully be detected when long time curves from nearby or quite distant regions are compared. German and Irish universities claim that they are doing such comparisons so that any errors should be detected (see e.g. ref 12 on replication). We may use the Danish mean value curve to compare our "creative collection" which has its Roman time settled 207 years later than
normally anticipated.
Nevertheless, a T-value of 6.7 as above, is usually not created by chance. There is usually some reason behind it. If we cannot believe in a 207-years cut-away alternative, then we have to assume that there are some errors with some of the Hollstein curves. E.g. that some of the curves have been based on an accidental mix of older and younger samples which would then create curve-matchings at two places in time. |
Can we extend the Roman time chronology?
According to Hollstein's curves, we have three more curves left to bridge the Roman and the Late time chronologies together, i.e.
BERL (Beerlegem), KKNA (Köln, Knabengrab, endyear 511) and BROI (Broichweiden).
We also have the two Dutch curves neth002 and neth006 from the ITRDB.
Transformation: Baillie/Pilcher (5,-2,T,eLog)
--Rel Over   Corr TTest   GLK  (year)
-year  lap  coeff
    8  136   0.63   9.5  0.67   (387) (as dated)
   33  113   0.31   3.4  0.57   (362)
   15  131   0.27   3.2  0.57   (380)
When matched with our Roman time collection, the correlation values of our "left-over curves" are:
Algorithm: Baillie/Pilcher (5,-2,T,eLog)
                 Member offset to ref------      Best match for TTest-------------
                 Off Over  Corr TTest   GLK      Off Over  Corr TTest   GLK  Sets-
        Years    set  lap coeff                  set  lap coeff             Ref to
all...    422   -214  206  0.37   5.6  0.64     -214  206  0.37   5.6  0.64   336
BERL      267   -214   51  0.24   1.7  0.53     -186*  79  0.34   3.2  0.54   364*
BROI      237    -29  206  0.21   3.1  0.58     -116* 119  0.35   4.0  0.69   249*
KKNA      239   -175   62  0.30   2.5  0.62      261* 237  0.31   4.9  0.64   772*
neth002   138    -51   85  0.34   3.3  0.62      -51   85  0.34   3.3  0.62   336
neth006   148    -59   87  0.24   2.3  0.63      210* 146  0.26   3.3  0.56   605*
neth2+6   148    -59   87  0.32   3.1  0.61      210* 146  0.30   3.7  0.59   605*
Algorithm: Hollstein (1,1,F,eLog)
all...    422   -214  207  0.36   5.6  0.64     -214  207  0.36   5.6  0.64   336
BERL      267   -214   52  0.20   1.4  0.52     -106* 160  0.28   3.7  0.58   444*
BROI      237    -29  207  0.19   2.7  0.58     -116* 120  0.40   4.8  0.69   249*
KKNA      239   -175   63  0.42   3.6  0.63      261* 238  0.28   4.4  0.64   772*
neth002   138    -51   86  0.36   3.5  0.62      -51   86  0.36   3.5  0.62   336
neth006   148    -59   88  0.34   3.3  0.64      528* 147  0.28   3.6  0.54   923*
neth2+6   148    -59   88  0.40   4.1  0.61      -59   88  0.40   4.1  0.61   336
With that low individual crossdating values towards our Roman-time collection, I would not consider any of these values as established crossdatings!
So the answer on "Can we extend the Roman time chronology?" is NO! We do not seem to have enough data for that!
Of course, if we want to get this job finished, we could add our curves to our Roman collection according to the table above.
Though there is not much mathematical evidence for its correctness. So we have to stop here!
Actually, we have proved NOTHING with this excercise!
Though we may come to one conclusion:
When Hollstein put his curves together to bridge curves of Roman time with curves of Late time, he put these curves
together on about the same conditions as shown above.
I.e. he put the curves where the current chronology and historical evidence said that they should be. Possibly with a weak support from dendrochronology.
This made his book finally published so we can read it and share his data - that was actually very generous and efficient!
P.S. - Those 207 years...
After finishing the text above, I made still some more testing...- Let me show...
We have our HollsteinBestLateToYear410.rwl and HollsteinBestRoman.rwl collections.
Let us copy the Roman collection into its conventional place in the Late collection.
This gives us a gap without samples between years 336 - 410.
Create the mean value sample from that and run a Blockwise crossdating quality test.

It is really peculiar that it also happens that we have no data for that interval in between...
According to calender and historical evidence there has to be a gap!

Then create the mean value sample from the HollsteinBestRoman collection and select it as the reference.
Save it as a reference file e.g. MBxxFB27.fil with the Collections/Save Collection As (.fil) command to get a labeling name on it!

The result is as above!
Normally that would be accepted as a match!
Now comes the problem with "replication" - curves from a neighbour or quite distant area should match over longer periods!
The Danish curve will not match if we remove 207 years. And still we have to place the Dutch neth002 and neth006!
Who is right? Probably not me! - A story like this had probably not escaped the dendrochronological society.
Then, what is left is a methodological problem.
For a dendrochronologist it is good to know, that a "match" as shown above is not good enough to be true! Or?
Note: If these problems are created because some Hollstein curves were not correctly summed when created from more than one stem, then there is no reason to talk about a methodological problem of today...
Either I have severely overlooked something or some Hollstein curves are not correctly created.

The Hollstein data for this period 213-336 does not match well to the Becker data, though there are matches at both year 336 and year 543.
These matchings depend very much on the normalization method used - as shown above!
12. Baillie M.G.L.: A slice through time, dendrochronology and precision dating, 1995. Routledge, ISBN 0 7134 7654 0.
Continue with the next section!
|
|