The pattern of the veins of the wings is specific for each breed of bees. It is an established method to measure characteristics of this pattern to distinguish breeds from each other.
Bees of pure breed are often good and kind bees. Here we describe a simple method to distinguish bees of a more pure breed from other bees. This method can quite easily be used by any interested bee-keeper who wants to choose the best colony to pick new queens from.
A number of beewings from a colony is mounted on a paper which is then scanned as an image on a standard office scanner. The wings can also be mounted on transparent film and scanned in a standard film scanner.

Mount a piece of tape with the sticky side upwards on a cardboard or stiff paper or easiest directly onto your desk. Put crossing bits of tape at the ends to keep it down.
Note: An alternative to this is using tape with adhesive coating on each side when mounting on paper or cardboard or on transparent film (when using a film scanner).
Place the wings on the tape. See that the wings are mounted quite near each other to make the scanned image as small as possible. Mount all wings in the same direction to make the successive coordinate recordings in CooRecorder more uniform and by that easier.
When you are ready mounting the wings put transparent film over the wings and towards the sticky tape.
Remove the whole thing from your table and put it onto your scanner with the transparent side downwards.
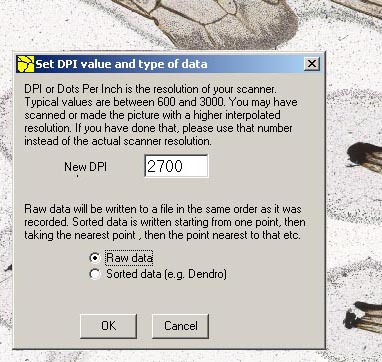
Make a scan of the sample. Select a high resolution corresponding to the optical resolution of your scanner.
Note: If you have no tranparent film at hand, you may put an extra layer of tape over the wings. But then the light from the scanner has to go through a layer of adhesive coating before it hits the wings. This distorts the picture of the wings.
Various brands of tape have different characteristics. Some have a more uniform coating than others. This matters when you are using a film scanner as you then have to let the light go through at least one layer of adhesive coating.
Using CooRecorder to measure bee wings
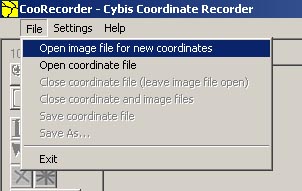
Click on File/Open image file for new coordinates and select your wing image file.
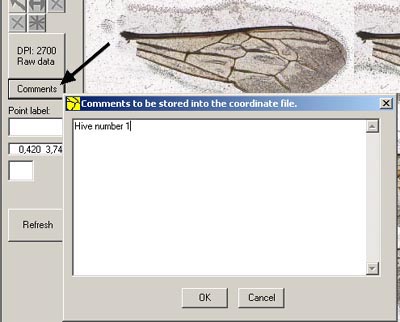
Click on the Comments button and enter a suitable name of this wing group, e.g. "Hive number 1"
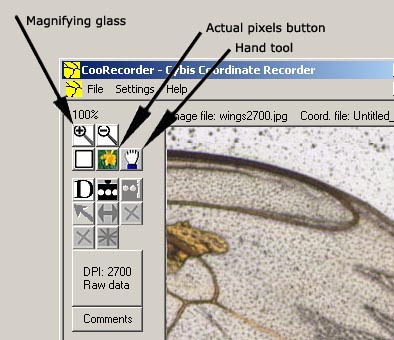
Click on the actual pixels button to get a high magnification. Use the hand tool and the scroll bars to position the picture properly. Click on the magnifying glass button. Then click the first wing repeatedly until its size fills up your screen.
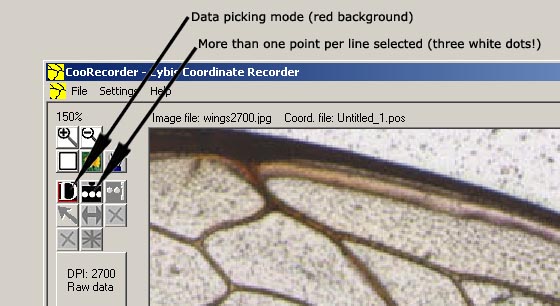
Select data picking mode and see that "more than one point per line" is selected. (then there are three white dots at the button face)
Start recording the first group/wing:
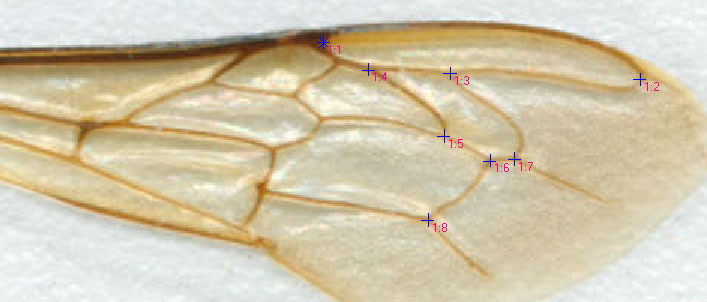
Be very careful with setting the points in their correct order, i.e. 1 to 8 exactly as shown in the picture.
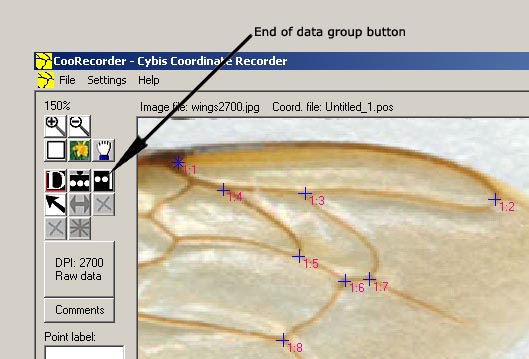
When you have clicked at the crossing point number 8, press the Enter key or click the End of data group button.
Then continue with the next wing.
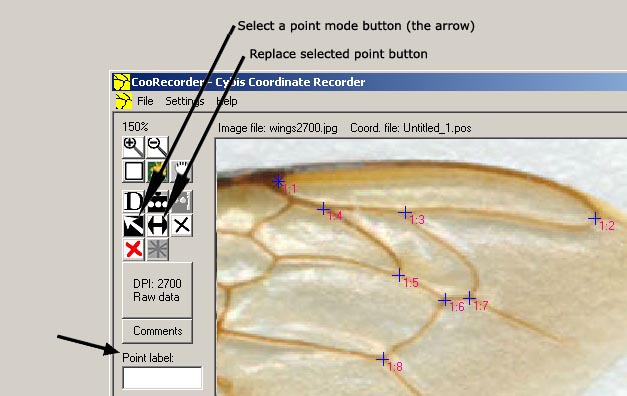
Replacing a point
If you want to replace (move) a single point:
Click on "Select a point mode (the button goes black). Then click on the appropriate point.
Click on "Replace selected point" and Click the place where you want the point repositioned.
Marking to identify a certain wing
You may attach a small comment to a wing, like e.g. "W2" for wing 2.
In that case write "W2" into the Point label field before you click any of the points of that wing. The label will be shown near the first point of the wing.
When all wings have been measured click on File/Save as ... and save your new bee wing coordinate file with an appropriate name e.g. hive1.pos
Using CBeeWing to analyze CooRecorder bee wing files
After start up of CBeeWing, click on File/Open Wing coordinate file and select your wing file.
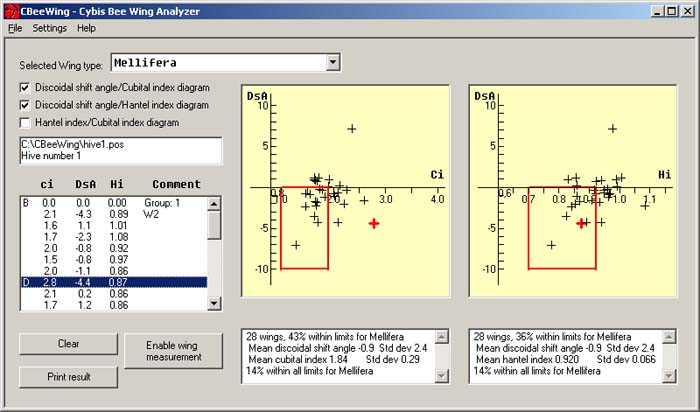
The wing data will be shown plotted in a diagram and also as numerical values in a list.
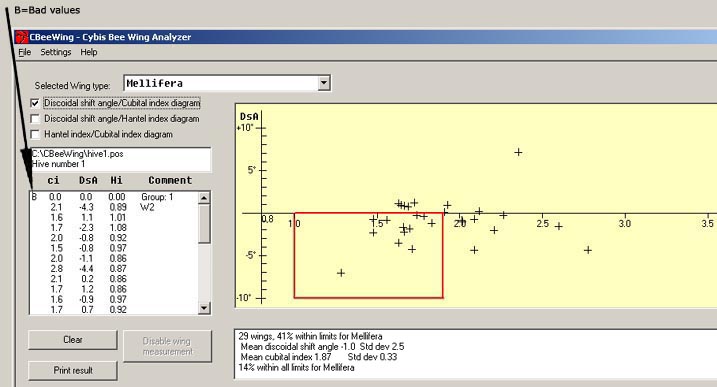
If there is anything wrong with a wing measurement, e.g. a missing point, that line is marked with a "B" (Bad values).
In the diagram the Discoidal shift Angle (DsA) is on the vertical axis and the Cubital index (Ci) is on the horizontal axis.
The red box in the diagram marks the limits for the choosen bee type, in this case "Mellifera". When the points are plotted closely connected within the box this signifies a typical pure Mellifera colony. When the points are spread over the diagram as shown above this signifies a colony mixed up with several breeds.
Below the diagram is a small report with mean values and standard deviations. On the first line there is also a value telling the percentage of wings falling inside the red box.
Note: As you will see when you read on, there is another type of selection criteria/red box for a wing index named "Hantel index". That proportion of wings which match all selection criterias are displayed on the last line of the report as eg. "14% within all limits for Mellifera".
Note: Before you load a new file with bee wing coordinates, you have to first empty the "wing basket" by clicking on the clear button. But this also implies that you can easily collect wing data from several coordinate files and have them calculated as a sum. In that case, don't clear the "wing basket" before loading the next file.
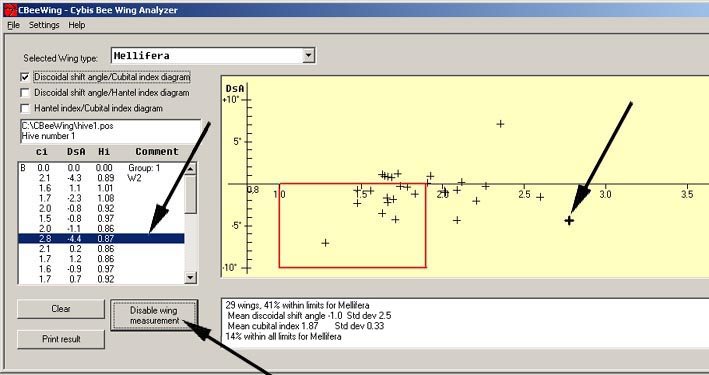
Sometimes one or two wings are plotted at some distance away from the rest of the points. This may signify wings which are not representative to this colony, e.g. they may come from another colony. This is a reason to remove them from the mean value calculations.
If so, click on the actual point and then click on the button "Disable wing measurement" The Report box is immediatly updated and the point turns red in the diagram. The line in the list will get a "D" in front of it.
Note: You may click either on a line in the list or on a point in the diagram. In any case both the list line and the point will get marked as shown above.
Printing on paper: If you need the plot on plain paper for filing, click on the "Print result" button.
(Note: Disabled points are not plotted on paper.)
Other wing types:
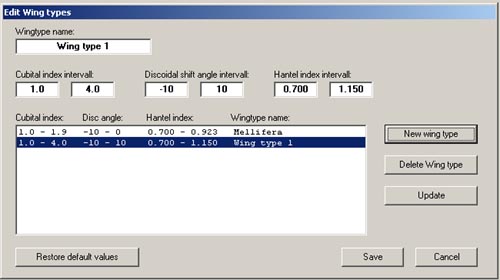
If you want to test your bee wings against other limits, this can easily be done by creating a new wing type within the program.
Click on Settings/Edit Wing types.
Then click on the New wing type button and set the various fields as appropriate. Click on update to enter your new values into the list and click on save to actually save your values within the program.
When back at the diagram select the appropriate wingtype from the combo box at the top of the form. The red line box will move and resize as defined by your new wing type.
The DsA / Hantel index diagram
You can also display the hantel indexes of your bee wings in a separate diagram.
To do that, click the corresponding check box at the top left part of your screen.
You may have both diagrams open at the same time and even have them printed together on paper.
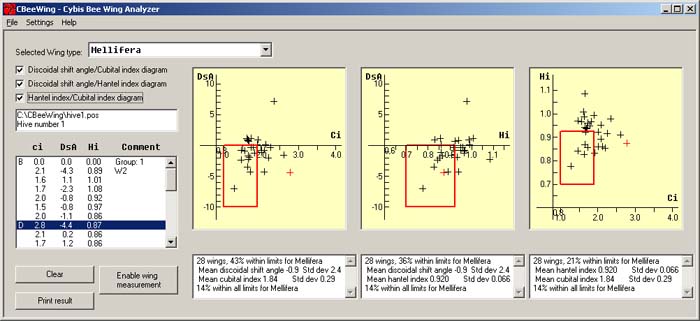
The Hantel Index / Cubital index diagram
There is also a third diagram showing the Hantel Index versus the Cubital index of your wings.
Click the corresponding check box at the top left part of your screen to get this diagram.
Note: The diagrams are printed on paper with a height which allows for all three on one paper. When printing only one or two diagrams you can get them somewhat larger (higher) by first checking "Settings/Larger printed diagrams" at the top menu bar. This may be useful if you need a larger diagram to be shown with an overhead projector.
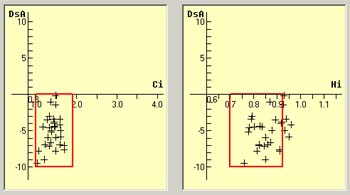
Mellifera queen inseminated with Mellifera drones
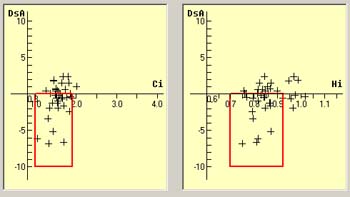
Mellifera queen free mated in surroundings of hive
Criteria for selecting - Some ideas told by Per Thunman
A good criteria for selecting pure breed is to find samples (wings from one hive) where the points are not scattered around but concentrated around one point.
Worst to select when wanting pure breed is a sample where all points are scattered over the diagram. That is a real intermix! They are usually very vivid.
When a pure queen is mated by some pure drones and some from a different breed the plot of wings from that colony will show more than one concentration of points. This queen can be used in breeding if the resulting queens are investigated by this method and those with wrong values are sorted out. In any case this queen is pure Mellifera and she can breed a lot of very pure Mellifera drones.
When cutting a wing of an egg laying queen, do carefully save the wing and measure it so that you know her characteristics.
Which bee is actually Mellifera - about an anomaly?
Now, what bees do I myself have in my apiary? The program says they are not Mellifera! The crosses are all outside the red boxes in both diagrams. I say: "It is fine that the diagrams agree"!
Though when inspecting a coordinate file made from 30 wings from Per Thunman I found that for about one third of the wings "the diagrams disagreed very much"! I.e. one diagram plotted the wing inside the red box saing "this is Mellifera" and the other diagram plotted it long way outside the red box saying "it's not!". But both diagrams said 32% Mellifera. You can look at the phenomenon by clicking on the first line in the list. Then repeatedly press the down-arrow key on your keyboard to select the next point. You can see the points jumping around in the diagrams!
I do not know if this anomaly is a serious problem when deciding what is Mellifera.
About precision
To find out the actual measurement precision I made 10 measurements of the same wing. After putting these measurements together in one coordinate file I made a plot of them with CBeeWing. This operation was done with three different wings.
One wing was scanned with a 1600 dpi high quality scanner (Epson Expression 1680), the other two wings with a Nikon LS-2000 film scanner with 2700 dpi resolution.
The standard deviations for these measurement were found to be: for DsA: 0.25, for Ci 0.06, for Hi 0.012
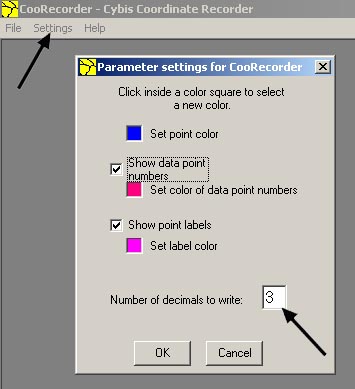
Thus when printing the values from one measurement of a bee wing I have decided to let the program print one decimal for DsA (though a bit optimistic), one decimal for Ci and 2 decimals for Hi.
This means that the precision of one measurement of a bee wing could be given as
DsA= 3.2 +/- 0.3 i.e. the decimal is a bit optimistic
Ci = 2.2 +/- 0.1 (i.e. you can trust this single decimal)
Hi = 0.98 +/- 0.01 ( --"-- )
When calculating mean values we may use one more extra decimal, but if this is of any significance when selecting for breed is another question!
Can you use CBeeWing to identify other breeds of bees than Mellifera and Carnica?
You can measure many geometrical properties from a bee wing.
Certain combinations of these properties characterize a certain breed of bees.
For the identification of Mellifera and Carnica it seems to be sufficent to analyze the relationships between discoidal shift angle and the cubital index.
The question is: Will a certain combination of discoidal shift angle, cubital index and hantel index identify e.g. Ligustica? - I do not know!
But - as a pure speculation:
CBeeWing is probably useful to generally find out whether there is a mix up of bee breeds within a hive. If the measured values are scattered around on the diagrams then you probably have an undesired mix up!
This is useful information when you select bees for further breeding!
Please write to me about your own experiences in this matter!
Lars-Åke Larsson
(Last update 21 January 2005)